鱼和熊掌我要兼得:ROS2适合量产吗
PUBLIC之前在学校的时候用ROS,在DJI的时候用一整套DJI自研的中间件。
大家都认可ROS的易用性,但同时觉得它几乎成了“低效”和“实验室原型”的代名词。
所以在产品上,DJI毫不犹豫地选择了高效路线,搭建了一整套自研中间件。
我长期关注C++的zero-overhead principle信条,所以始终觉得很不服气:为什么中间件就不能既好用,又高效?
很有趣,最近用了一些时间做了一些实验,感觉整个过程是一个很值得讨论的技巧分享。
所以记录下来。
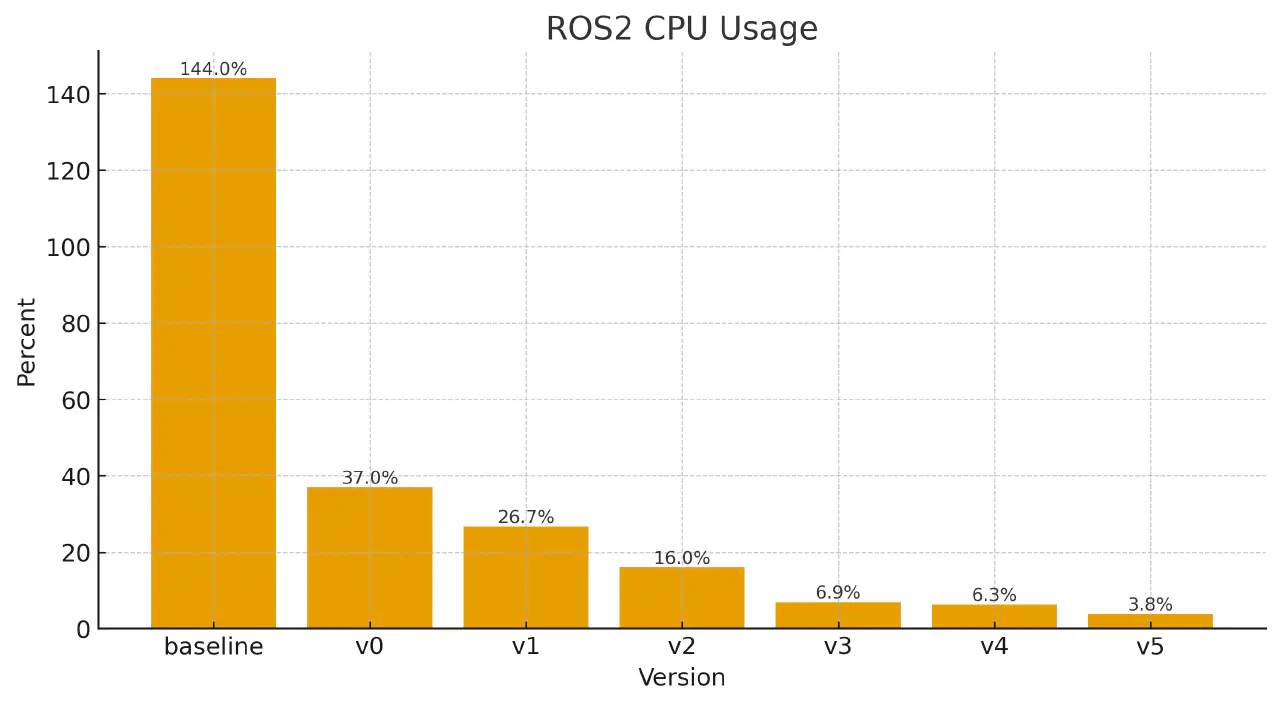
先说结论:在一个接近真实场景的case里面,从第一个版本的144% CPU占用,优化到了3.8%,提高了接近40倍的效率。
前情提要
小电脑和大电脑中记录一些优化分析的技巧。总结下来可能就是一句话,了解你的硬件的极限。
对于中间件来说,无非这些功能:进程内和进程间的消息传递;记录文本log;记录二进制log;可视化工具。
这些功能希望能实现等效效果的前提下,用最少的CPU,毕竟我们希望CPU都用在有用的计算上。
依次分析:
- 通信,基础的实现是复制,大家的追求是zero-copy。所以应该几乎不占用CPU。
- 记录,基础的实现是fwrite,大家追求的是async。所以也应该几乎不占用CPU。
讲到这里我们就知道,我们的目标就是中间件几乎不占用CPU,可能就是单核的个位数占用率。
接下来我们看看ROS2是否可以到达这个目标。
先测量,再优化,基线版本 144%
在这里假设一个场景。
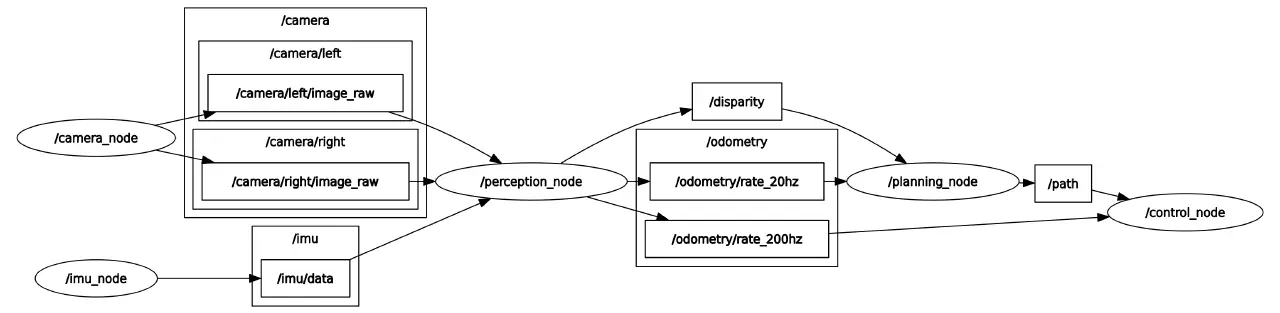
一个完全mock的tinynav。传感器是20hz的720p灰度图双目相机和200hz的IMU。
计算设备是地平线x5:
sunrise@ubuntu:~/workspace/data$ lscpu

Architecture:             aarch64
  CPU op-mode(s):         32-bit, 64-bit
  Byte Order:             Little Endian
CPU(s):                   8
  On-line CPU(s) list:    0-7
Vendor ID:                ARM
  Model name:             Cortex-A55
    Model:                0
    Thread(s) per core:   1
    Core(s) per cluster:  8
    Socket(s):            -
    Cluster(s):           1
    Stepping:             r2p0
    Frequency boost:      disabled
    CPU max MHz:          1500.0000
    CPU min MHz:          300.0000
    BogoMIPS:             48.00
    Flags:                fp asimd evtstrm crc32 atomics fphp asimdhp cpuid asimdrdm lrcpc dcpop asimddp
Caches (sum of all):
  L1d:                    256 KiB (8 instances)
  L1i:                    256 KiB (8 instances)
  L2:                     512 KiB (8 instances)
  L3:                     1 MiB (1 instance)
Vulnerabilities:
  Gather data sampling:   Not affected
  Itlb multihit:          Not affected
  L1tf:                   Not affected
  Mds:                    Not affected
  Meltdown:               Not affected
  Mmio stale data:        Not affected
  Reg file data sampling: Not affected
  Retbleed:               Not affected
  Spec rstack overflow:   Not affected
  Spec store bypass:      Not affected
  Spectre v1:             Mitigation; __user pointer sanitization
  Spectre v2:             Not affected
  Srbds:                  Not affected
  Tsx async abort:        Not affected
先来一个baseline:
.
|-- camera_node.cpp
|-- control_node.cpp
|-- imu_node.cpp
|-- perception_node.cpp
`-- planning_node.cpp
每个node一个文件。拿最简单的 imu_node.cpp 看下:
#include <rclcpp/rclcpp.hpp>
#include <sensor_msgs/msg/imu.hpp>

using namespace std::chrono_literals;

class ImuNode : public rclcpp::Node {
public:
  ImuNode() : Node("imu_node") {
    publisher_ = this->create_publisher<sensor_msgs::msg::Imu>("imu/data", 10);
    timer_ =
        this->create_wall_timer(5ms, std::bind(&ImuNode::timer_callback, this));
  }

private:
  void timer_callback() {
    auto msg = sensor_msgs::msg::Imu();
    msg.header.stamp = this->now();
    msg.header.frame_id = "imu_frame";

    msg.angular_velocity.x = 0.0;
    msg.angular_velocity.y = 0.0;
    msg.angular_velocity.z = 0.1;

    msg.linear_acceleration.x = 0.0;
    msg.linear_acceleration.y = 0.0;
    msg.linear_acceleration.z = 9.81;

    publisher_->publish(msg);
  }

  rclcpp::Publisher<sensor_msgs::msg::Imu>::SharedPtr publisher_;
  rclcpp::TimerBase::SharedPtr timer_;
};

int main(int argc, char *argv[]) {
  rclcpp::init(argc, argv);
  rclcpp::spin(std::make_shared<ImuNode>());
  rclcpp::shutdown();
  return 0;
}
好了,我们开始测量。
perf stat -p `pidof perception_node` -- sleep 10

 Performance counter stats for process id '4273':

          5,235.91 msec task-clock:u                     #    0.523 CPUs utilized
                 0      context-switches:u               #    0.000 /sec
                 0      cpu-migrations:u                 #    0.000 /sec
                 0      page-faults:u                    #    0.000 /sec
     1,427,684,811      cycles:u                         #    0.273 GHz
       647,318,281      instructions:u                   #    0.45  insn per cycle
        80,985,594      branches:u                       #   15.467 M/sec
         8,084,009      branch-misses:u                  #    9.98% of all branches

      10.008814607 seconds time elapsed
好的,果然很慢,其他node都不想看了。
perf stat -p `pidof camera_node` -- sleep 10

 Performance counter stats for process id '4269':

          3,853.95 msec task-clock:u                     #    0.385 CPUs utilized
                 0      context-switches:u               #    0.000 /sec
                 0      cpu-migrations:u                 #    0.000 /sec
            83,600      page-faults:u                    #   21.692 K/sec
       744,176,154      cycles:u                         #    0.193 GHz
       334,364,721      instructions:u                   #    0.45  insn per cycle
        37,471,342      branches:u                       #    9.723 M/sec
         1,250,800      branch-misses:u                  #    3.34% of all branches

      10.005158820 seconds time elapsed

perf stat -p `pidof imu_node` -- sleep 10

 Performance counter stats for process id '4271':

          1,489.53 msec task-clock:u                     #    0.149 CPUs utilized
                 0      context-switches:u               #    0.000 /sec
                 0      cpu-migrations:u                 #    0.000 /sec
                 0      page-faults:u                    #    0.000 /sec
       367,451,810      cycles:u                         #    0.247 GHz
       157,764,377      instructions:u                   #    0.43  insn per cycle
        21,899,768      branches:u                       #   14.703 M/sec
         3,772,083      branch-misses:u                  #   17.22% of all branches

      10.005567466 seconds time elapsed

perf stat -p `pidof planning_node` -- sleep 10

 Performance counter stats for process id '4275':

          1,085.09 msec task-clock:u                     #    0.108 CPUs utilized
                 0      context-switches:u               #    0.000 /sec
                 0      cpu-migrations:u                 #    0.000 /sec
                 0      page-faults:u                    #    0.000 /sec
       287,269,466      cycles:u                         #    0.265 GHz
       133,133,318      instructions:u                   #    0.46  insn per cycle
        16,560,378      branches:u                       #   15.262 M/sec
         1,443,901      branch-misses:u                  #    8.72% of all branches

      10.007625344 seconds time elapsed

perf stat -p `pidof control_node` -- sleep 10

 Performance counter stats for process id '4277':

          2,838.80 msec task-clock:u                     #    0.284 CPUs utilized
                 0      context-switches:u               #    0.000 /sec
                 0      cpu-migrations:u                 #    0.000 /sec
                 0      page-faults:u                    #    0.000 /sec
       725,161,289      cycles:u                         #    0.255 GHz
       370,651,301      instructions:u                   #    0.51  insn per cycle
        52,844,557      branches:u                       #   18.615 M/sec
         7,309,073      branch-misses:u                  #   13.83% of all branches

      10.005027786 seconds time elapsed
加合起来是1.44个核。
V0 锁住CPU频率 37%
理解你的硬件,是否错过了关键的控制变量。
for cpu in /sys/devices/system/cpu/cpu[0-9]*; do
    echo performance | sudo tee $cpu/cpufreq/scaling_governor
done
我们喜欢静态的系统,体现在方方面面,静态的内存。静态的CPU频率。以及作为结果的静态的CPU负载。
sunrise@ubunperf stat -p `pidof perception_node` -- sleep 10

 Performance counter stats for process id '4273':

          1,553.52 msec task-clock:u                     #    0.155 CPUs utilized
                 0      context-switches:u               #    0.000 /sec
                 0      cpu-migrations:u                 #    0.000 /sec
                 0      page-faults:u                    #    0.000 /sec
     1,868,415,448      cycles:u                         #    1.203 GHz
       660,517,840      instructions:u                   #    0.35  insn per cycle
        82,970,194      branches:u                       #   53.408 M/sec
         8,116,746      branch-misses:u                  #    9.78% of all branches

      10.004774491 seconds time elapsed

sunrise@ubuntu:~/workspace/data$ perf stat -p `pidof camera_node` -- sleep 10

 Performance counter stats for process id '4269':

            720.49 msec task-clock:u                     #    0.072 CPUs utilized
                 0      context-switches:u               #    0.000 /sec
                 0      cpu-migrations:u                 #    0.000 /sec
                 0      page-faults:u                    #    0.000 /sec
       951,908,198      cycles:u                         #    1.321 GHz
       334,262,236      instructions:u                   #    0.35  insn per cycle
        37,364,399      branches:u                       #   51.860 M/sec
         1,122,648      branch-misses:u                  #    3.00% of all branches

      10.004771016 seconds time elapsed

sunrise@ubuntu:~/workspace/data$ perf stat -p `pidof imu_node` -- sleep 10

 Performance counter stats for process id '4271':

            442.39 msec task-clock:u                     #    0.044 CPUs utilized
                 0      context-switches:u               #    0.000 /sec
                 0      cpu-migrations:u                 #    0.000 /sec
                 0      page-faults:u                    #    0.000 /sec
       481,199,305      cycles:u                         #    1.088 GHz
       158,023,331      instructions:u                   #    0.33  insn per cycle
        21,924,993      branches:u                       #   49.560 M/sec
         3,771,693      branch-misses:u                  #   17.20% of all branches

      10.004882884 seconds time elapsed

sunrise@ubuntu:~/workspace/data$ perf stat -p `pidof planning_node` -- sleep 10

 Performance counter stats for process id '4275':

            365.89 msec task-clock:u                     #    0.037 CPUs utilized
                 0      context-switches:u               #    0.000 /sec
                 0      cpu-migrations:u                 #    0.000 /sec
                 0      page-faults:u                    #    0.000 /sec
       419,252,329      cycles:u                         #    1.146 GHz
       137,643,995      instructions:u                   #    0.33  insn per cycle
        17,233,971      branches:u                       #   47.102 M/sec
         1,496,232      branch-misses:u                  #    8.68% of all branches

      10.004889550 seconds time elapsed

sunrise@ubuntu:~/workspace/data$ perf stat -p `pidof control_node` -- sleep 10

 Performance counter stats for process id '4277':

            644.55 msec task-clock:u                     #    0.064 CPUs utilized
                 0      context-switches:u               #    0.000 /sec
                 0      cpu-migrations:u                 #    0.000 /sec
                 0      page-faults:u                    #    0.000 /sec
       755,655,328      cycles:u                         #    1.172 GHz
       287,431,393      instructions:u                   #    0.38  insn per cycle
        40,744,616      branches:u                       #   63.214 M/sec
         6,137,673      branch-misses:u                  #   15.06% of all branches

      10.005378124 seconds time elapsed
加起来0.372个CPU核。很大的提高,但是其实是之前的测量不准确。
好像可以了吗,我们继续往后。
V1 single process, multiple thread 26.7%
我们不用5个node/process了,换成一个,但是用executor去安排:
int main(int argc, char *argv[]) {
  rclcpp::init(argc, argv);

  // Create node options without intra-process communication
  rclcpp::NodeOptions options;
  options.use_intra_process_comms(false);

  // Create all nodes without intra-process communication
  auto camera_node = std::make_shared<CameraNode>(options);
  auto imu_node = std::make_shared<ImuNode>(options);
  auto perception_node = std::make_shared<PerceptionNode>(options);
  auto planning_node = std::make_shared<PlanningNode>(options);
  auto control_node = std::make_shared<ControlNode>(options);

  // Create multi-threaded executor
  rclcpp::executors::MultiThreadedExecutor executor(
      rclcpp::ExecutorOptions(), 8); // 8 threads for all nodes

  // Add all nodes to executor
  executor.add_node(camera_node);
  executor.add_node(imu_node);
  executor.add_node(perception_node);
  executor.add_node(planning_node);
  executor.add_node(control_node);

  RCLCPP_INFO(rclcpp::get_logger("main"),
              "All nodes started with multi-threaded executor and "
              "no intra-process communication");
  RCLCPP_INFO(rclcpp::get_logger("main"),
              "Nodes: Camera (20Hz), IMU (200Hz), Perception (20Hz), Planning "
              "(20Hz), Control (200Hz)");

  executor.spin();

  rclcpp::shutdown();
  return 0;
}
测量一下。
sudo perf record -g -p `pidof giant_nodes_system_v1` -- sleep 10

Performance counter stats for process id '7396':

       2,667.23 msec task-clock:u                     #    0.267 CPUs utilized
              0      context-switches:u               #    0.000 /sec
              0      cpu-migrations:u                 #    0.000 /sec
         90,099      page-faults:u                    #   33.780 K/sec
  2,989,886,366      cycles:u                         #    1.121 GHz
  1,768,020,433      instructions:u                   #    0.59  insn per cycle
    243,045,912      branches:u                       #   91.123 M/sec
     12,328,677      branch-misses:u                  #    5.07% of all branches

   10.004910597 seconds time elapsed
有一定提升。把 multi-process 换成 multi-thread 确实减少了开销,至于具体原因,有时间再细分析。
不过值得一提的是,如果想优化调度之类的问题,例如优先级,实时性,核亲和性,thread和process具备同样的功能,在Linux的处理里面,是不做区分的。
可能主要的区别就是内存空间的问题,process内部,可以不需要做地址的转换,共享同一个memory page,process之间就需要用shared memory相关的系统调用了。
然后继续分析,我们先跑一个火焰图。

从打印里面可以看出来,一个Image msg,从 camera_node 到 perception_node 已经经历了复制:
[INFO] [1756955429.751859783] [camera_node]: Publishing left image at address: 0xffff60001cf0
[INFO] [1756955429.752962456] [perception_node]: Received left image at address: 0xffff68000b80
[INFO] [1756955429.754733717] [perception_node]: Received right image at address: 0xffff6400a200
[INFO] [1756955429.754863010] [perception_node]: Processing stereo images at addresses: left 0xffff68000b80, right 0xffff6400a200
V2 intra-process zero-copy 16.0%
如上面所说,如果我们把任务都保留在一个进程内,我们可以减少复制。
在ROS2中开启这个feature也很简单: options.use_intra_process_comms(true)
测一下:
sudo perf record -g -p `pidof giant_nodes_system_v2` -- sleep 10

Performance counter stats for process id '15691':

       1,597.49 msec task-clock:u                     #    0.160 CPUs utilized
              0      context-switches:u               #    0.000 /sec
              0      cpu-migrations:u                 #    0.000 /sec
         25,076      page-faults:u                    #   15.697 K/sec
  1,837,091,696      cycles:u                         #    1.150 GHz
  1,010,977,273      instructions:u                   #    0.55  insn per cycle
    140,877,405      branches:u                       #   88.187 M/sec
      8,593,332      branch-misses:u                  #    6.10% of all branches

   10.004934483 seconds time elapsed
明显的提高啊。火焰图如下:

通过打印检查一下是否是同一个对象:
[INFO] [1756956492.805418607] [camera_node]: Publishing left image at address: 0xaaaab18bbb10
[INFO] [1756956492.805616065] [perception_node]: Received left image at address: 0xaaaab18bbb10
[INFO] [1756956492.805697899] [perception_node]: Received right image at address: 0xaaaab1793150
[INFO] [1756956492.805758066] [perception_node]: Processing stereo images at addresses: left 0xaaaab18bbb10, right 0xaaaab1793150
符合预期。
V3 Static Executor 6.9%
火焰图中已经有很多是和消息的等待有关了,线程间同步。
此时想到,我们也许也不需要多线程,只需要把消息发送都用在single thread,各个node除了接受消息之外,自己起thread去做计算。
如果这样的话, StaticSingleThreadedExecutor 就很适合我们,得到第三版:
sudo perf record -g -p `pidof giant_nodes_system_v3` -- sleep 10

Performance counter stats for process id '16150':

         694.89 msec task-clock:u                     #    0.069 CPUs utilized
              0      context-switches:u               #    0.000 /sec
              0      cpu-migrations:u                 #    0.000 /sec
              0      page-faults:u                    #    0.000 /sec
    874,690,659      cycles:u                         #    1.259 GHz
    466,580,545      instructions:u                   #    0.53  insn per cycle
     66,610,771      branches:u                       #   95.858 M/sec
      3,786,256      branch-misses:u                  #    5.68% of all branches

   10.004895885 seconds time elapsed
又是很明显的提高。

这个结果已经很好了。
V4 TCMalloc 6.3%
从上面的思路来看,我们也不追求消除所有的内存操作,毕竟大部分的msg都是很小的,我们主要优化图像。
而 sensor_msgs::msg::Image 是一个动态对象,除了对象头部信息,还有一个 data 是动态的 vector 。
就算是我们传递消息的时候做到了zero-copy,每次新的图片,在目前的实现中,也是一个新的对象,需要申请这个vector的内存。
从火焰图中还能看到不少与 page fault 相关的部分( el0_da )。
能不能优化这一点呢。可以,但是大部分思路都比较难搞。
- 可以不用
sensor_msgs::msg::Image,而是换成一个静态的msg。但是代价就是现有的可视化工具都用不了了。 - 用
sensor_msgs::msg::Image_<VoidAlloc>,但是给一个memory pool的简单实现。但是。。和1一样,sensor_msgs::msg::Image_<VoidAlloc>其实也不被现有的工具支持, 毕竟已经完全不是一个type了。 - 重载unique_ptr的delete,每次“释放”的时候,实际去做一个回收。实验下来,发现ROS有一个自己的delete,不能改变,具体原因也可以再看看。
最后选了一个更粗暴的方法,既然我只关心图片的内存,而且图片的内存尺寸总是固定的。那么我可以要求malloc库针对重复分配的尺寸进行缓存。
这也就是(我理解的)tcmalloc的思路。
测试一下:
LD_PRELOAD=/usr/lib/aarch64-linux-gnu/libtcmalloc_minimal.so.4 ros2 run ros2_efficiency_test giant_nodes_system_v3

Performance counter stats for process id '17388':

         631.34 msec task-clock:u                     #    0.063 CPUs utilized
              0      context-switches:u               #    0.000 /sec
              0      cpu-migrations:u                 #    0.000 /sec
            320      page-faults:u                    #  506.858 /sec
    821,420,073      cycles:u                         #    1.301 GHz
    454,039,167      instructions:u                   #    0.55  insn per cycle
     64,927,835      branches:u                       #  102.841 M/sec
      3,489,579      branch-misses:u                  #    5.37% of all branches

   10.004872700 seconds time elapsed
效果看起来不算特别明显。
V5 CycloneDDS 3.8%
再往后就是感觉DDS本身的操作比较多了。
我们换一换试试:
RMW_IMPLEMENTATION=rmw_cyclonedds_cpp LD_PRELOAD=/usr/lib/aarch64-linux-gnu/libtcmalloc_minimal.so.4 ros2 run ros2_efficiency_test giant_nodes_system_v3

Performance counter stats for process id '17646':

          379.74 msec task-clock:u                     #    0.038 CPUs utilized
               0      context-switches:u               #    0.000 /sec
               0      cpu-migrations:u                 #    0.000 /sec
               3      page-faults:u                    #    7.900 /sec
     445,157,443      cycles:u                         #    1.172 GHz
     179,113,939      instructions:u                   #    0.40  insn per cycle
      28,939,796      branches:u                       #   76.209 M/sec
       2,528,278      branch-misses:u                  #    8.74% of all branches

    10.004862817 seconds time elapsed
挺好的提高。
总结
代码放在:https://github.com/dvorak0/ros2_efficiency_test
todos
- 同时考虑rosbag record
- 测试一下Loaned Messages
吐槽
先测量,再提高。说起来一句很简单的话,但是有多少时候能做到。
更多时候,在一个组织里面,用一个带有fancy词汇的PPT,项目就上马了。什么zero-copy,direct IO,shared memory,lightweight,一片欢快的气氛。
可能真的阅读别人的代码,真的比自己写一遍要难很多。

我记得本科的时候有个朋友说:“我的XFCE非常轻量级,虽然功能少,但是启动快啊”,在同一个笔记本上做了实验对比KDE,没想到是“不仅启动慢,而且功能少”。
真的是往事了,说起来现在已经很久没用过功能这么丰富的桌面了,大家的电脑也被橙黄色覆盖了。
我对ROS充满感激,虽然确实有很多缺点,但是无数次在搭建原型的时候给我一种愉快的使用体验。
想新写中间件的工程师,如果真的想击败ROS,为什么不考虑加入ROS的committee直接把ROS变成自己心中的样子呢。
再一次想到开源经济学的一些东西,不管怎么说ROS的git历史都会永远的保留下去,但是dji_sys就未必了。
同时也非常理解吧。
哈哈,老朋友们看到这里不要骂我。let’s_have_a_talk。